Categories
Economic Forecasts, Housing Market Trends, Real Estate Market Trends, Inventory, EconomyPublished October 13, 2025
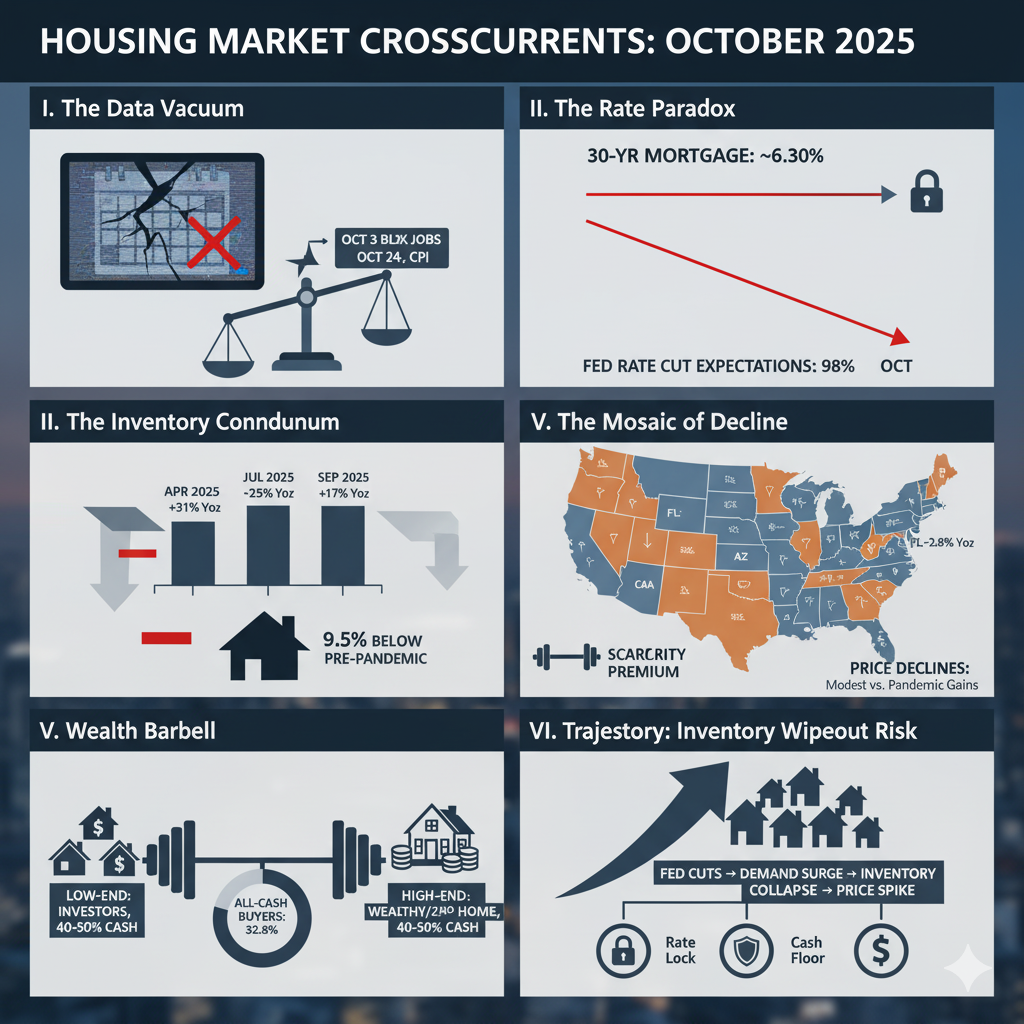
The Data Vacuum: How the Government Shutdown Masks a Fragile Housing Market Equilibrium

I. The Silence of the Sirens: Navigating the Data Blackout
The financial landscape in October 2025 is defined by an extreme information deficit. The ongoing federal government shutdown has resulted in a critical delay in the release of essential economic indicators, plunging policy makers and market analysts into a data vacuum that severely limits clarity on the nation's economic health. With an estimated 750,000 workers furloughed due to the political stalemate
The most immediate casualty of the shutdown was the Bureau of Labor Statistics (BLS) employment report for September 2025, which was originally scheduled for October 3.
In the absence of official government statistics, market participants have been forced to rely on a patchwork of private-sector data, which is sending dissonant signals. Private labor gauges suggest severe weakness: ADP reported a net job loss of 32,000 in September, while the Carlyle Group offered a highly conservative estimate of just 17,000 jobs added (User Query). However, this narrative of general collapse is contradicted by corporate signals. The Challenger Job Cuts report noted that US-based employers announced 54,064 job cuts in September 2025, representing the lowest volume in three months and a significant 25.8% decrease year-over-year.
The lack of core governmental data forces analysts to pivot, subtly shifting the focus from a strictly data-driven policy approach to one centered on financial stability. The market is increasingly interpreting the systemic risk posed by the political crisis as the dominant factor, leading participants to believe that the Fed’s focus has moved toward preventing a monetary fallout from the shutdown itself. This necessitates heavy reliance on conflicting private sources and non-core indicators, such as international bond yields, which inevitably increases trading volatility as no single, consensus data point anchors market expectations.
II. The Rate Paradox: Steady at 6.3% Amid Hardening Cut Bets
The bond and mortgage markets currently reflect a profound contradiction: 30-year fixed mortgage rates remain stubbornly high, yet the market’s conviction in imminent, aggressive Federal Reserve intervention has reached near-certainty.
The Stubborn Anchor of Housing Finance
Despite the economic volatility stemming from the data blackout, the average 30-year fixed mortgage rate has anchored firmly around 6.30% (6.30% as of October 9, 2025).
This sustained high mortgage rate structurally reinforces the "lock-in" effect. Homeowners who refinanced or bought during the low-rate era of 2020–2022 are unwilling to sell and trade their sub-4% mortgage for a 6.30% rate, thereby artificially constraining supply. The bond market, through its sustained inflationary skepticism, is unintentionally stabilizing existing home prices by preventing the massive supply shock that lower mortgage rates would otherwise induce.
Pricing in Systemic Risk
In stark contrast to the stable mortgage rates, the futures market has overwhelmingly priced in sharp, immediate cuts to the FFR. Data from the CME FedWatch Tool as of October 10 shows a staggering 98.1% probability that the FOMC will execute a rate cut at its October 29 meeting.
The following table summarizes the market’s sharp expectations for policy action:
Fed Funds Rate Futures Probability Shift (October 10, 2025)
| FOMC Meeting Date | Current FFR Range (bps) | Expected Rate Change (bps) | Probability of Cut (Oct 10) |
| October 29, 2025 | 400-425 | -25 to -50 bps |
98.1% |
| December 10, 2025 | 400-425 | -50 bps (Cumulative) | 82% (User Query) |
III. The Inventory Conundrum: A Decelerating Rebound, Not a Supply Surge
The housing market has exhibited a noticeable, though mild, shift toward buyers over the past year, evidenced by rising inventory levels, longer Days on Market (DOM), and an increased prevalence of listing price reductions (User Query). However, the momentum behind this inventory recovery is rapidly dissipating, suggesting that the national supply deficit remains a structural impediment.
The Softening of Supply Growth
The velocity of the inventory rebound has cooled significantly. In September 2025, total active inventory (excluding homes under contract) rose +17% year-over-year to 1.1 million units. This marks a substantial deceleration from the +25% year-over-year increase observed in July 2025 and the peak growth rate of +31% year-over-year recorded in April 2025 (User Query).
Despite these positive annual growth figures, the national supply remains fundamentally tight. Active inventory is currently 9.5% to 10% below pre-pandemic levels (September 2019). Even among the Top 100 most populous cities, inventory is still 9% below the September 2019 baseline. This underscores that while the market is less severely undersupplied than it was 18 months ago, it is nowhere near historical equilibrium.
The Seller Pullback Hypothesis and Structural Scarcity
The deceleration in inventory growth is not merely a statistical anomaly; it likely reflects a strategic seller pullback. Sellers, observing the market’s decisive expectation of imminent Fed rate cuts, are behaving rationally by choosing to delay listing their homes. These owners anticipate that future rate cuts will bring a rush of financed, first-time buyers back into the market, allowing them to command a better price later. If this anticipation—a positive outlook on future price strength—causes sellers to withhold listings, the inventory increase slows, which in turn acts to reinforce the current price floor.
The market’s current shift toward buyers is highly fragile. The achieved inventory gains, modest as they are, relied on the high 6.30% mortgage rates suppressing demand. The current deceleration suggests that the market quickly absorbs available supply even at this high rate environment. This means the narrow window of the "buyer's market" is likely to close abruptly once the Fed acts, confirming that national supply is hitting a structural wall that will prevent sustained price moderation.
IV. The Mosaic of Decline: Regional Price Elasticity and Divergence
National price statistics camouflage intense regional divergence, illustrating that the impact of supply imbalances is highly localized. While national median listing prices are down year-over-year for about 60% of the Top 100 metros, the price corrections are largely modest compared to the appreciation realized during the pandemic era (User Query).
The Sunbelt and Mountain West Inventory Overhang
The market is clearly bifurcated between states that experienced massive pandemic migration and those with structural supply constraints. Sixteen states, primarily located in the Sunbelt and Mountain West, currently have active inventory levels (September 2025) that are above their pre-pandemic levels (September 2019). This list includes states like Tennessee (+34.8%), Texas (+30.5%), Florida (+22.6%), and Arizona (+27.8%), all of which saw heavy migration flows and significant construction activity between 2020 and 2022. Texas, for instance, now has nearly twice as many active listings as California, despite California remaining the largest state by population (User Query).
In these high-supply states, price trends reflect the abundance. There are 26 states currently seeing year-over-year median listing price declines, and 10 of these are also on the list of states with inventory above 2019 levels. Key states showing notable annual price reductions include Arizona (-4.0% YoY), Florida (-2.8% YoY), and Texas (-2.7% YoY).
The most notable stress points are found in specific metropolitan areas, particularly those that experienced extreme growth or are facing unique economic pressures: Honolulu, HI, saw the steepest decline (-8.8% YoY), followed by Durham, NC (-7.5%), and the high-volume Florida markets like Cape Coral-Ft Myers FL (-7.0%) and Miami-Ft Lauderdale FL (-4.8%).
The Equity Buffer and the California Scarcity Premium
The primary reason these high-inventory, declining-price states are not experiencing a rapid price collapse is the massive equity cushion built up by homeowners. As of the second quarter of 2025, over 47% of mortgaged homes were deemed "equity-rich".
In contrast, California, which significantly under-indexes for active listings relative to its size, operates under a scarcity premium. This self-imposed scarcity, driven by high regulation and zoning constraints, insulates the state’s prices from national inventory trends, resulting in a relatively modest year-over-year decline of 2.5% in listing prices (User Query).
V. The Wealth Barbell: Why All-Cash Sales Define the Market Floor
The stability and resilience of the housing market in the face of 6.30% mortgage rates are fundamentally sustained by a rate-agnostic class of buyers: the all-cash cohort. This group provides a deep structural floor for housing demand, regardless of Federal Reserve policy.
The Persistence of Capital Dominance
In the first half of 2025, all-cash buyers accounted for 32.8% of all home sales.
The sustained high percentage of cash purchases underscores the critical roles of wealth concentration and inflation hedging in today's housing market. For investors, housing is a hedge against inflation. For the wealthy, it is a safe asset class that allows them to bypass high borrowing costs entirely.
Analyzing the Cash Barbell Effect
All-cash activity is not uniformly distributed but is instead concentrated at the extreme ends of the price spectrum, creating a distinct "barbell" effect.
Cash is highly dominant in two areas:
-
The Low-End Investment Floor: Affordable markets, such as Mississippi and New Mexico, see 40–50% of sales conducted in cash. This is the domain of investors—both large institutional firms and smaller local operators—who rapidly absorb inventory as soon as prices dip toward yielding profitability (e.g., houses priced around $180,000) (User Query).
-
The High-End Wealth Haven: High-priced luxury and second-home markets, including Maine, Hawaii, Montana, and Idaho, also see cash sales accounting for 40–50% of transactions. Here, affluent buyers use cash to purchase lodges and estates, securing assets without incurring high financing costs (User Query).
This dual concentration establishes a formidable Investor Price Floor Imperative. If prices begin to fall meaningfully, particularly in the lower-priced segments, investor yields instantly improve, triggering a rush of cash liquidity that halts the price decline. This dynamic acts as an automatic stabilization mechanism, preventing a true housing "crash" under current monetary and wealth conditions.
VI. Synthesis and Trajectory: The Imminent Inventory Wipeout Risk
The "Vacuum" of October 2025 has created a precarious and temporary market equilibrium. The current modesty of price declines and the fragile shift toward buyers mask severe underlying tensions that are set to break upon the Fed’s next policy move.
The national housing market resilience is currently maintained by three interdependent structural pillars:
-
The Rate-Lock Barrier: The stability of 30-year fixed mortgage rates at 6.30% enforces the lock-in effect, artificially suppressing the available housing supply.
-
The Equity Buffer: Near-record home equity levels act as a massive structural defense against forced liquidations, ensuring price stability even in regions facing high inventory surpluses.
-
The Cash Floor: Over 30% of market transactions are rate-agnostic, providing a perpetual source of demand that is particularly aggressive at the lowest price points, effectively establishing a solid floor below which prices cannot fall without being absorbed by capital.
The market’s expectation of imminent Federal Reserve rate cuts (98.1% probability for October 29) creates an acute risk for the housing sector. As financial experts warn, cooling rates too quickly could "create a surge in demand that would wipe away any inventory gains, causing home prices to spike".
The conclusion is not a crash, but a rapid reversal. The current, modest shift toward buyers will likely be annihilated, erasing the temporary "enhanced affordability" and potentially reverting the market to the fierce price appreciation and intense affordability crisis that characterized the 2020–2022 period. The true trajectory of the housing market hinges not on the mild corrections of today, but on the explosive demand expected to be unleashed by the policy adjustments of tomorrow.

Michael Joseph Devlin
Broker | Devlin Real Estate Group | eXP Realty | PLACE
or another way